


Hello and welcome! Today, I'm gonna show you how to use the vscode debugger and how to configure it for all your needs. I hope this article results useful to you and let's go!
Creating the project
First, We need to create a folder called Debugger to save all in there. This is needed to keep the .vscode folder, that holds the debugger files, and have everything in an unique folder.
mkdir Debugger
cd Debugger
Then, create a net6.0 console project which we will use to see the debugger in action and open vscode.
dotnet new console -n Proj1
code .
Debug your first project.
After opening vscode you should see this in Program.cs file.
// See https://aka.ms/new-console-template for more information
Console.WriteLine("Hello, World!");
If not so, the code is ok too. This is just the template for console projects in net6.0, but the debugger works fine with all version of .NET.
Creating debugger files
If you haven't installed the extension for C# yet, you can go to the extension bar, search for C# and install the extension.
If you already have the extension you should see this message after omnisharp finish loading.
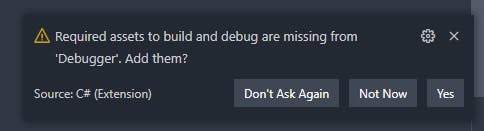
And if you press Yes the vscode will create the tasks.json and launch.json files to run the debugger.
Or
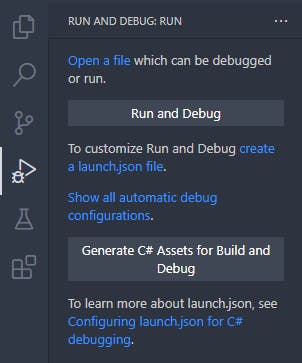
If you don't see the window you can press Ctrl+shift+p to open the command palette and write .NET: Generate Assests for Build and Debug and execute the command.
Or
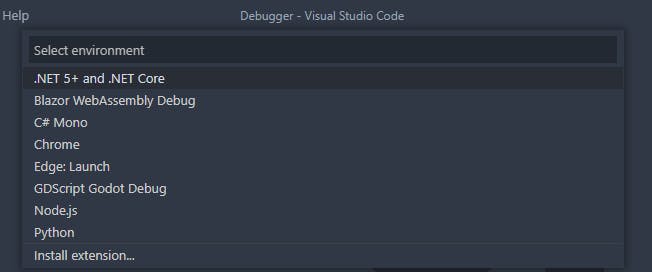
Go to the debugger bar and press create a launch.json file
and select your project target framework. In this case .NET 5+ and .NET Core.
Adding breakpoints
A breakpoint is a flag that you set in a line of code to stop the program before the line is executed.
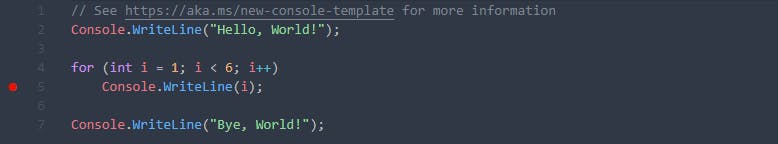
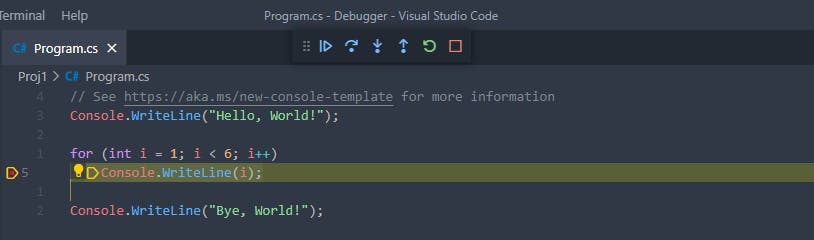
So, go to Program.cs file and add the following code below the hello world.
for (int i = 1; i < 6; i++)
    Console.WriteLine(i);

Console.WriteLine("Bye, World!");
then go to the line below the for-loop and add a breakpoint by pressing f9.
A red point will show at the left of your editor like this.
If you press Ctrl+f5 the program will build and execute without the debugger and print the followed in the debug console.
Hello, World!
1
2
3
4
5
Bye, World!
Running the Debugger
If you press f5 the project will be build and after that the debugger will be launch. Then the Debug console will appear. In this console you can also change the variables values. Also will display the debugger bar showing all variables, the call stacks and breakpoints.
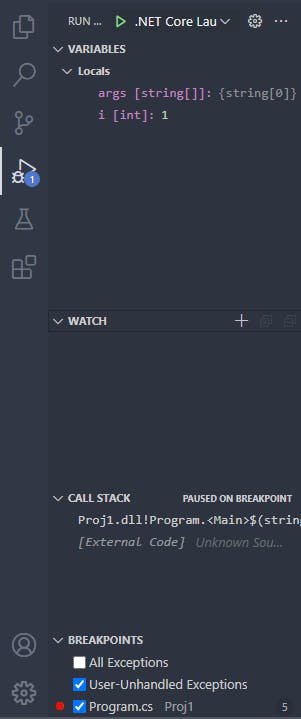
And the code will stop at the breakpoint.
Playing with the debugger
You will see a highlighted yellow line that show the next line of code to be executed.
You also see this bar
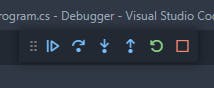 From left to right, the buttons have this functions:
- Continue
f5: Continues the execution until the next breakpoint. - Step Over
f10: Execute just the next line to be executed. - Step Into
f11: jump into the function in the highlighted yellow line. - Step Out
Shift+f11: jump out of the function to the last stack call. - Restart
Ctrl+Shift+f5: Restart the the building and re launch the debugger. - Stop
Shift+f5: Stop the program.
The debug console
Also with the debug console you can change the value of the variables.
If you write the following expression in the debug console RELP.
i = -3
You will see in the debugger bar that the variable "i" changes his value from 0 to -3. If you finish executing all the program the final output should be the next.
Hello, World!
-3
-2
-1
0
1
2
3
4
5
Bye, World!
Debugging Multiple Projects
If you ever have using Visual Studio, and had more than one project, you have notice the ease of changing the debugger configuration out of the box. In vscode we need to config the debugger to have something similar.
Setting Up More Projects
Let's create another console project, a solution file and add the projects to the solution with the following lines.
dotnet new console -n Proj2
dotnet new sln
dotnet sln add **/*proj
Tasks.json
Now, we need to modify the tasks.json file, specifically, the build task. The tasks.json file is used to automate scripts execution and process execution like build, test and publish. We need change the build task so it builds all the solution and not just the Proj1.csproj.
So open the vscode/tasks.json file and you should see this tasks in the file.
{
    "label": "build",
    "command": "dotnet",
    "type": "process",
    "args": [
        "build",
        "${workspaceFolder}/Proj1/Proj1.csproj",
        "/property:GenerateFullPaths=true",
        "/consoleloggerparameters:NoSummary"
    ],
    "problemMatcher": "$msCompile"
},
And just remove the Proj1.csproj direction from the task, like this.
{
    "label": "build",
    "command": "dotnet",
    "type": "process",
    "args": [
        "build",
        "${workspaceFolder}",
        "/property:GenerateFullPaths=true",
        "/consoleloggerparameters:NoSummary"
    ],
    "problemMatcher": "$msCompile"
},
Now vscode builds all the solution and you don't need to build every projects manually.
Add Debug Configuration
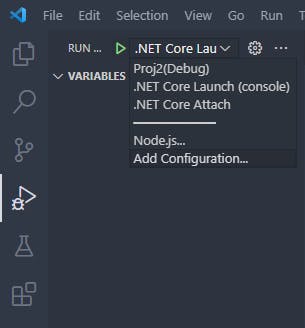
Now, you need to add a new configuration to launch.json. Just go to the debug bar and select Add Configuration... like this.
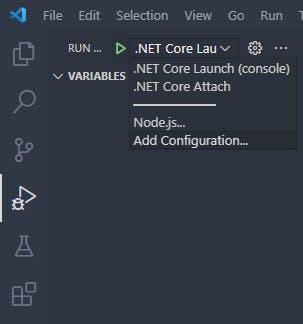
And will asks you to select what type of configuration you want
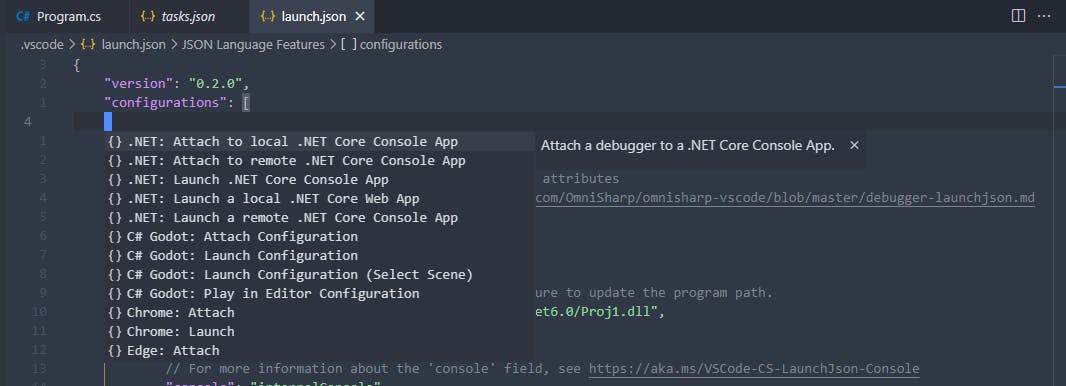
After you select the configuration change the name of the configuration and the program argument to "${workspaceFolder}//bin/Debug//.dll", like this.
{
    "name": "Proj2(Debug)",
    "type": "coreclr",
    "request": "launch",
    "preLaunchTask": "build",
    "program": "${workspaceFolder}/Proj2/bin/Debug/net6.0/Proj2.dll",
    "args": [],
    "cwd": "${workspaceFolder}",
    "stopAtEntry": false,
    "console": "internalConsole"
},
If you inspected the file for your self you already have notice another arguments like args, to add arguments when the debugger launch; stopAtEntry, if you want to stop at the first line of code of the program and console, to select what console you can use to debug.
And then you can see the configuration added to the debug bar and changed as you wish.
Conclusions
Well, we learn in this article how to use the debugger and configure by your self for c#. I hope this article helps you with your developer journey.
Thank you for read my article and see you soon!!!